How to Create T Chart in Canva
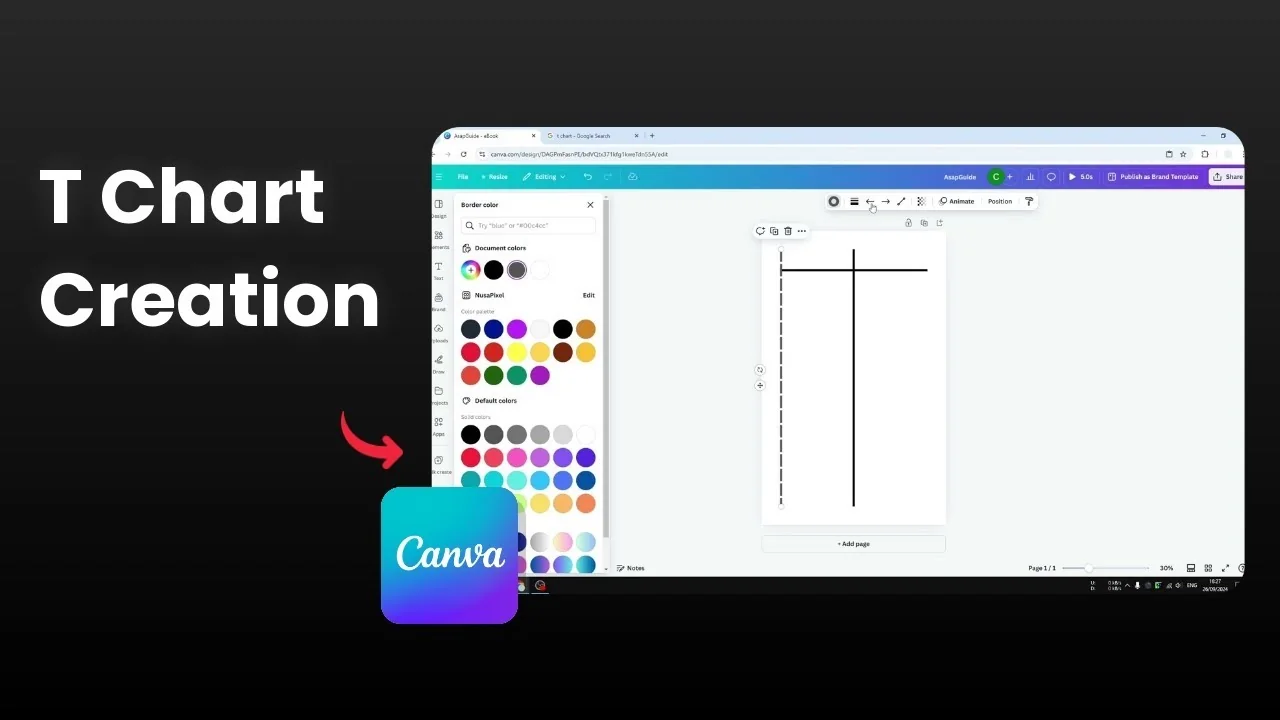
I will show you how you can create a simple T chart using Canva. A T chart is not very difficult to create because it only consists of a few lines. It resembles the letter T, and you can build one in Canva in just two or three minutes.
Setup for Create T Chart in Canva
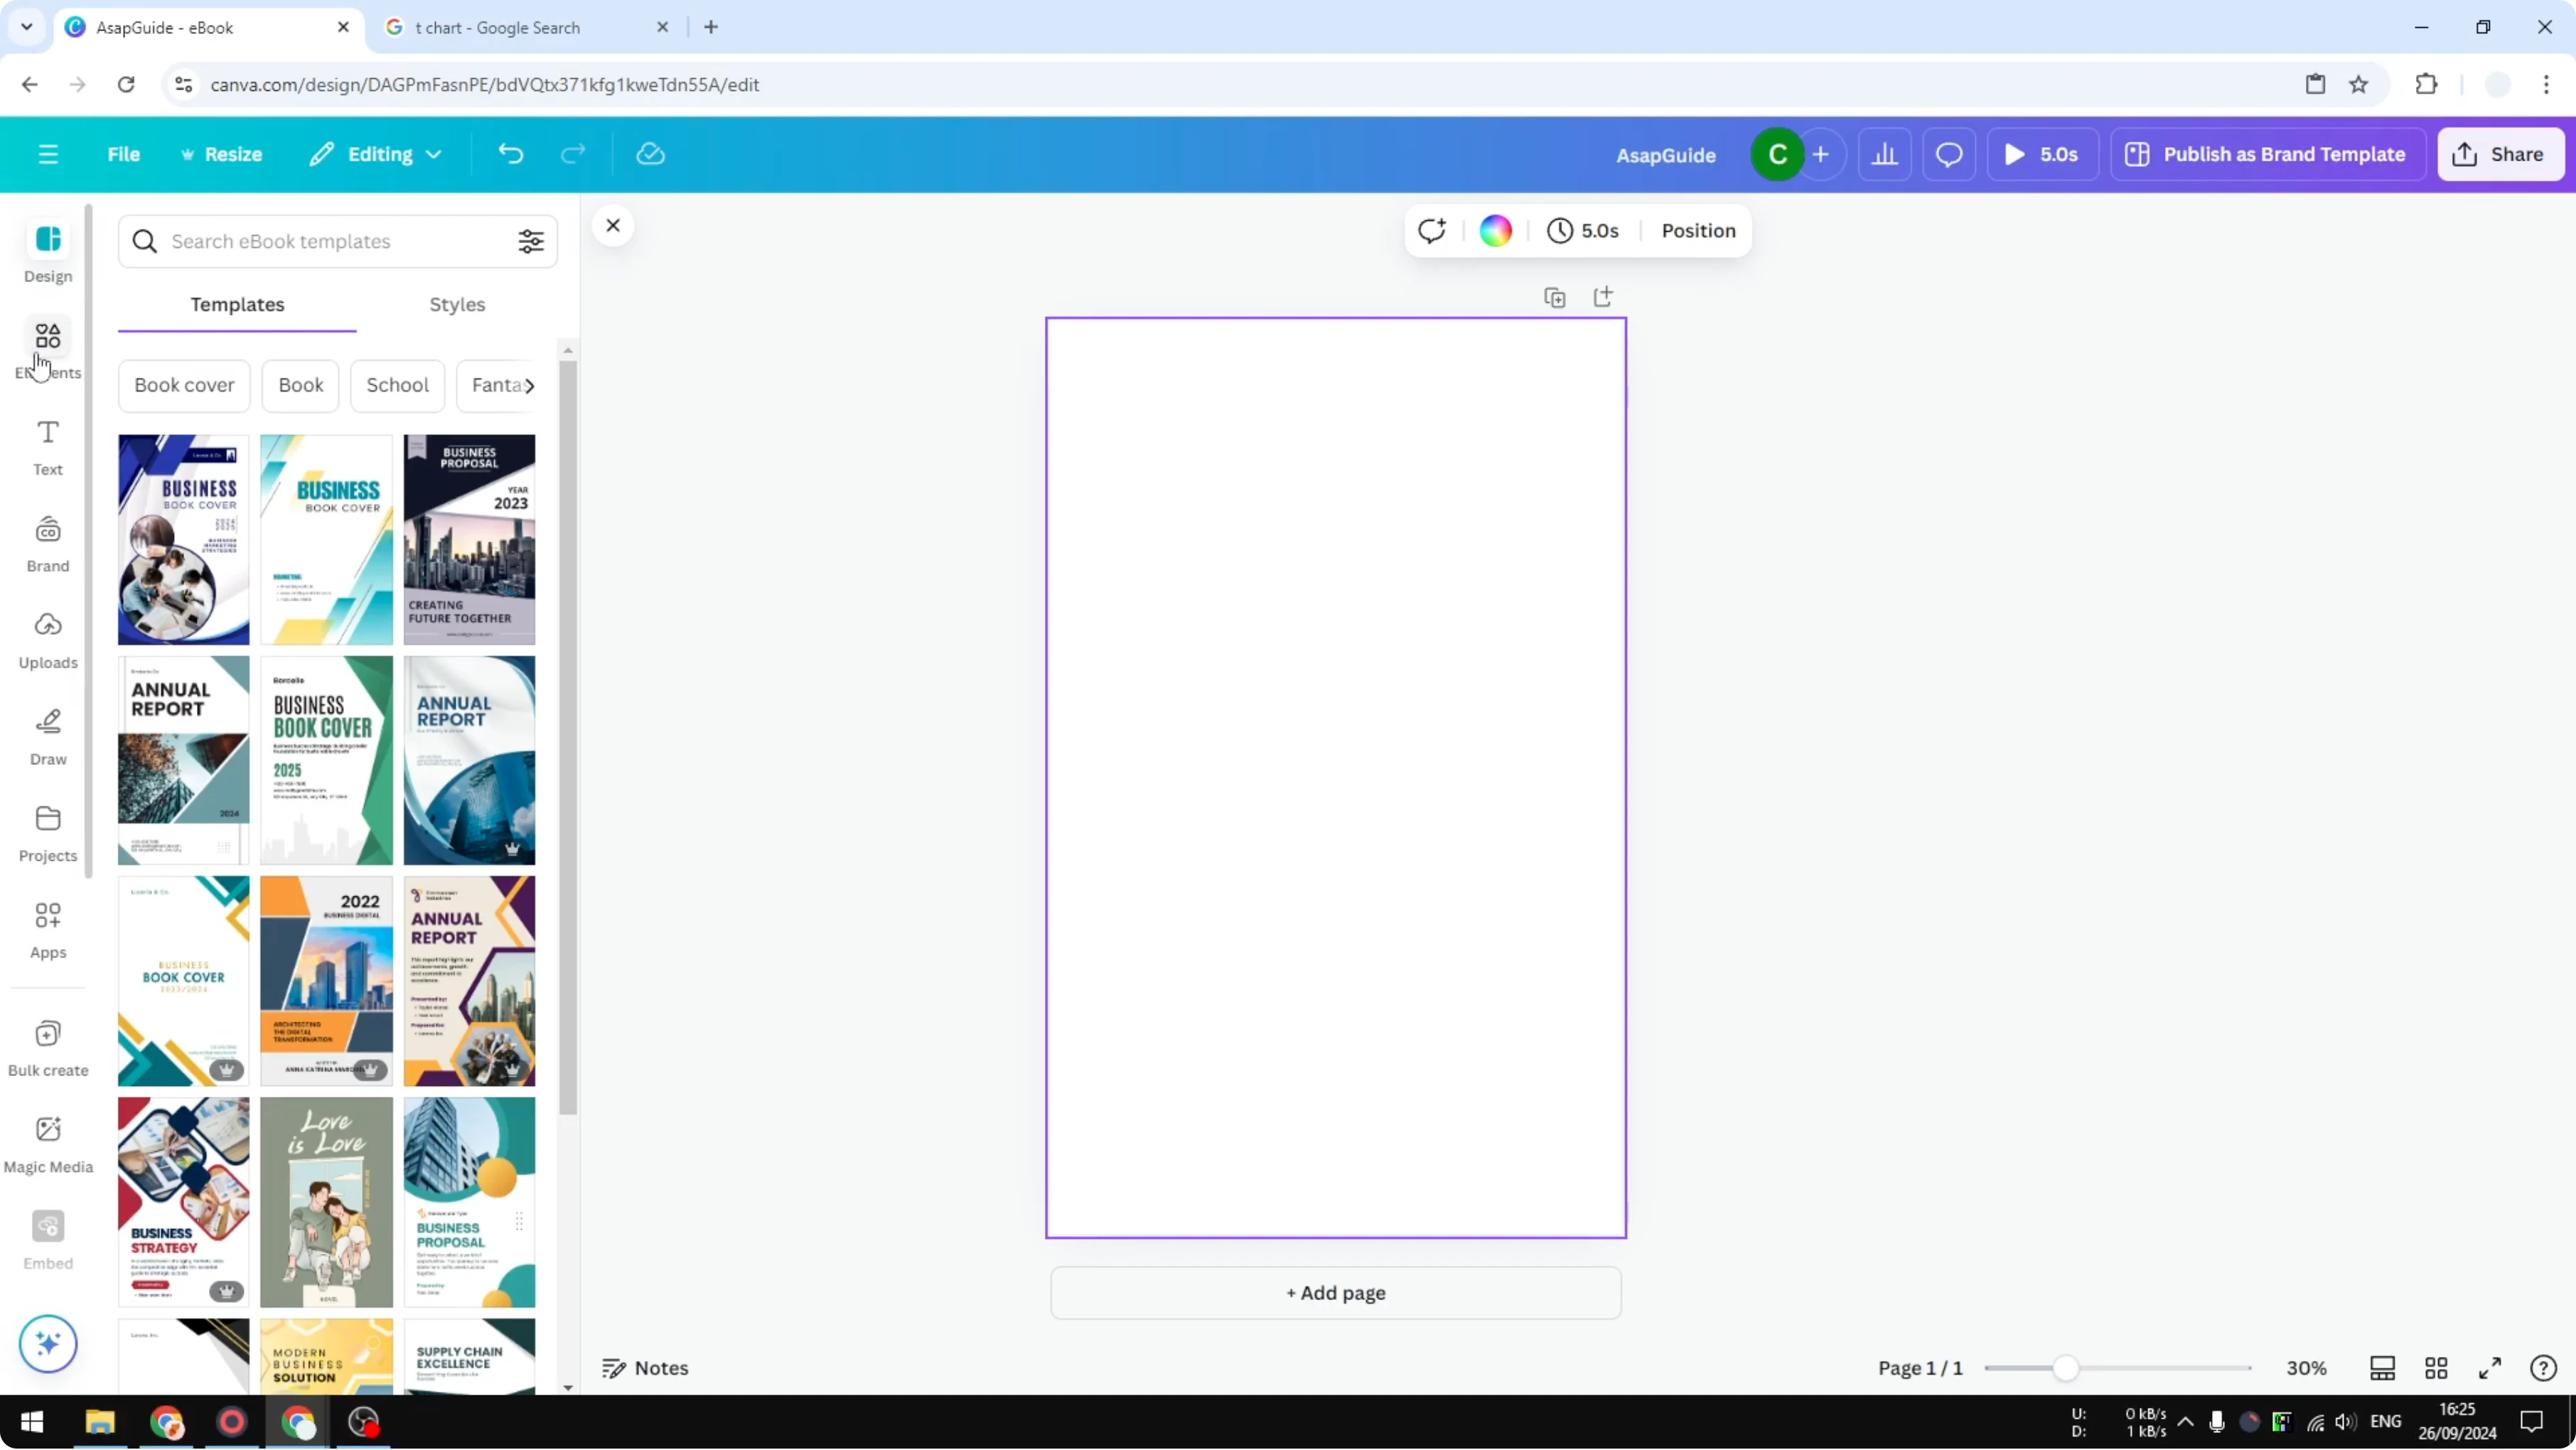
Go to Canva and start a new design. I recommend using a vertical document because it is usually the most useful dimension for a T chart.

You could use a square or horizontal document, but if you want to maximize the amount of space available, choose a vertical document. If you are also planning other chart types, see create a pie chart in Canva.
Draw the lines for Create T Chart in Canva
Vertical line in Create T Chart in Canva
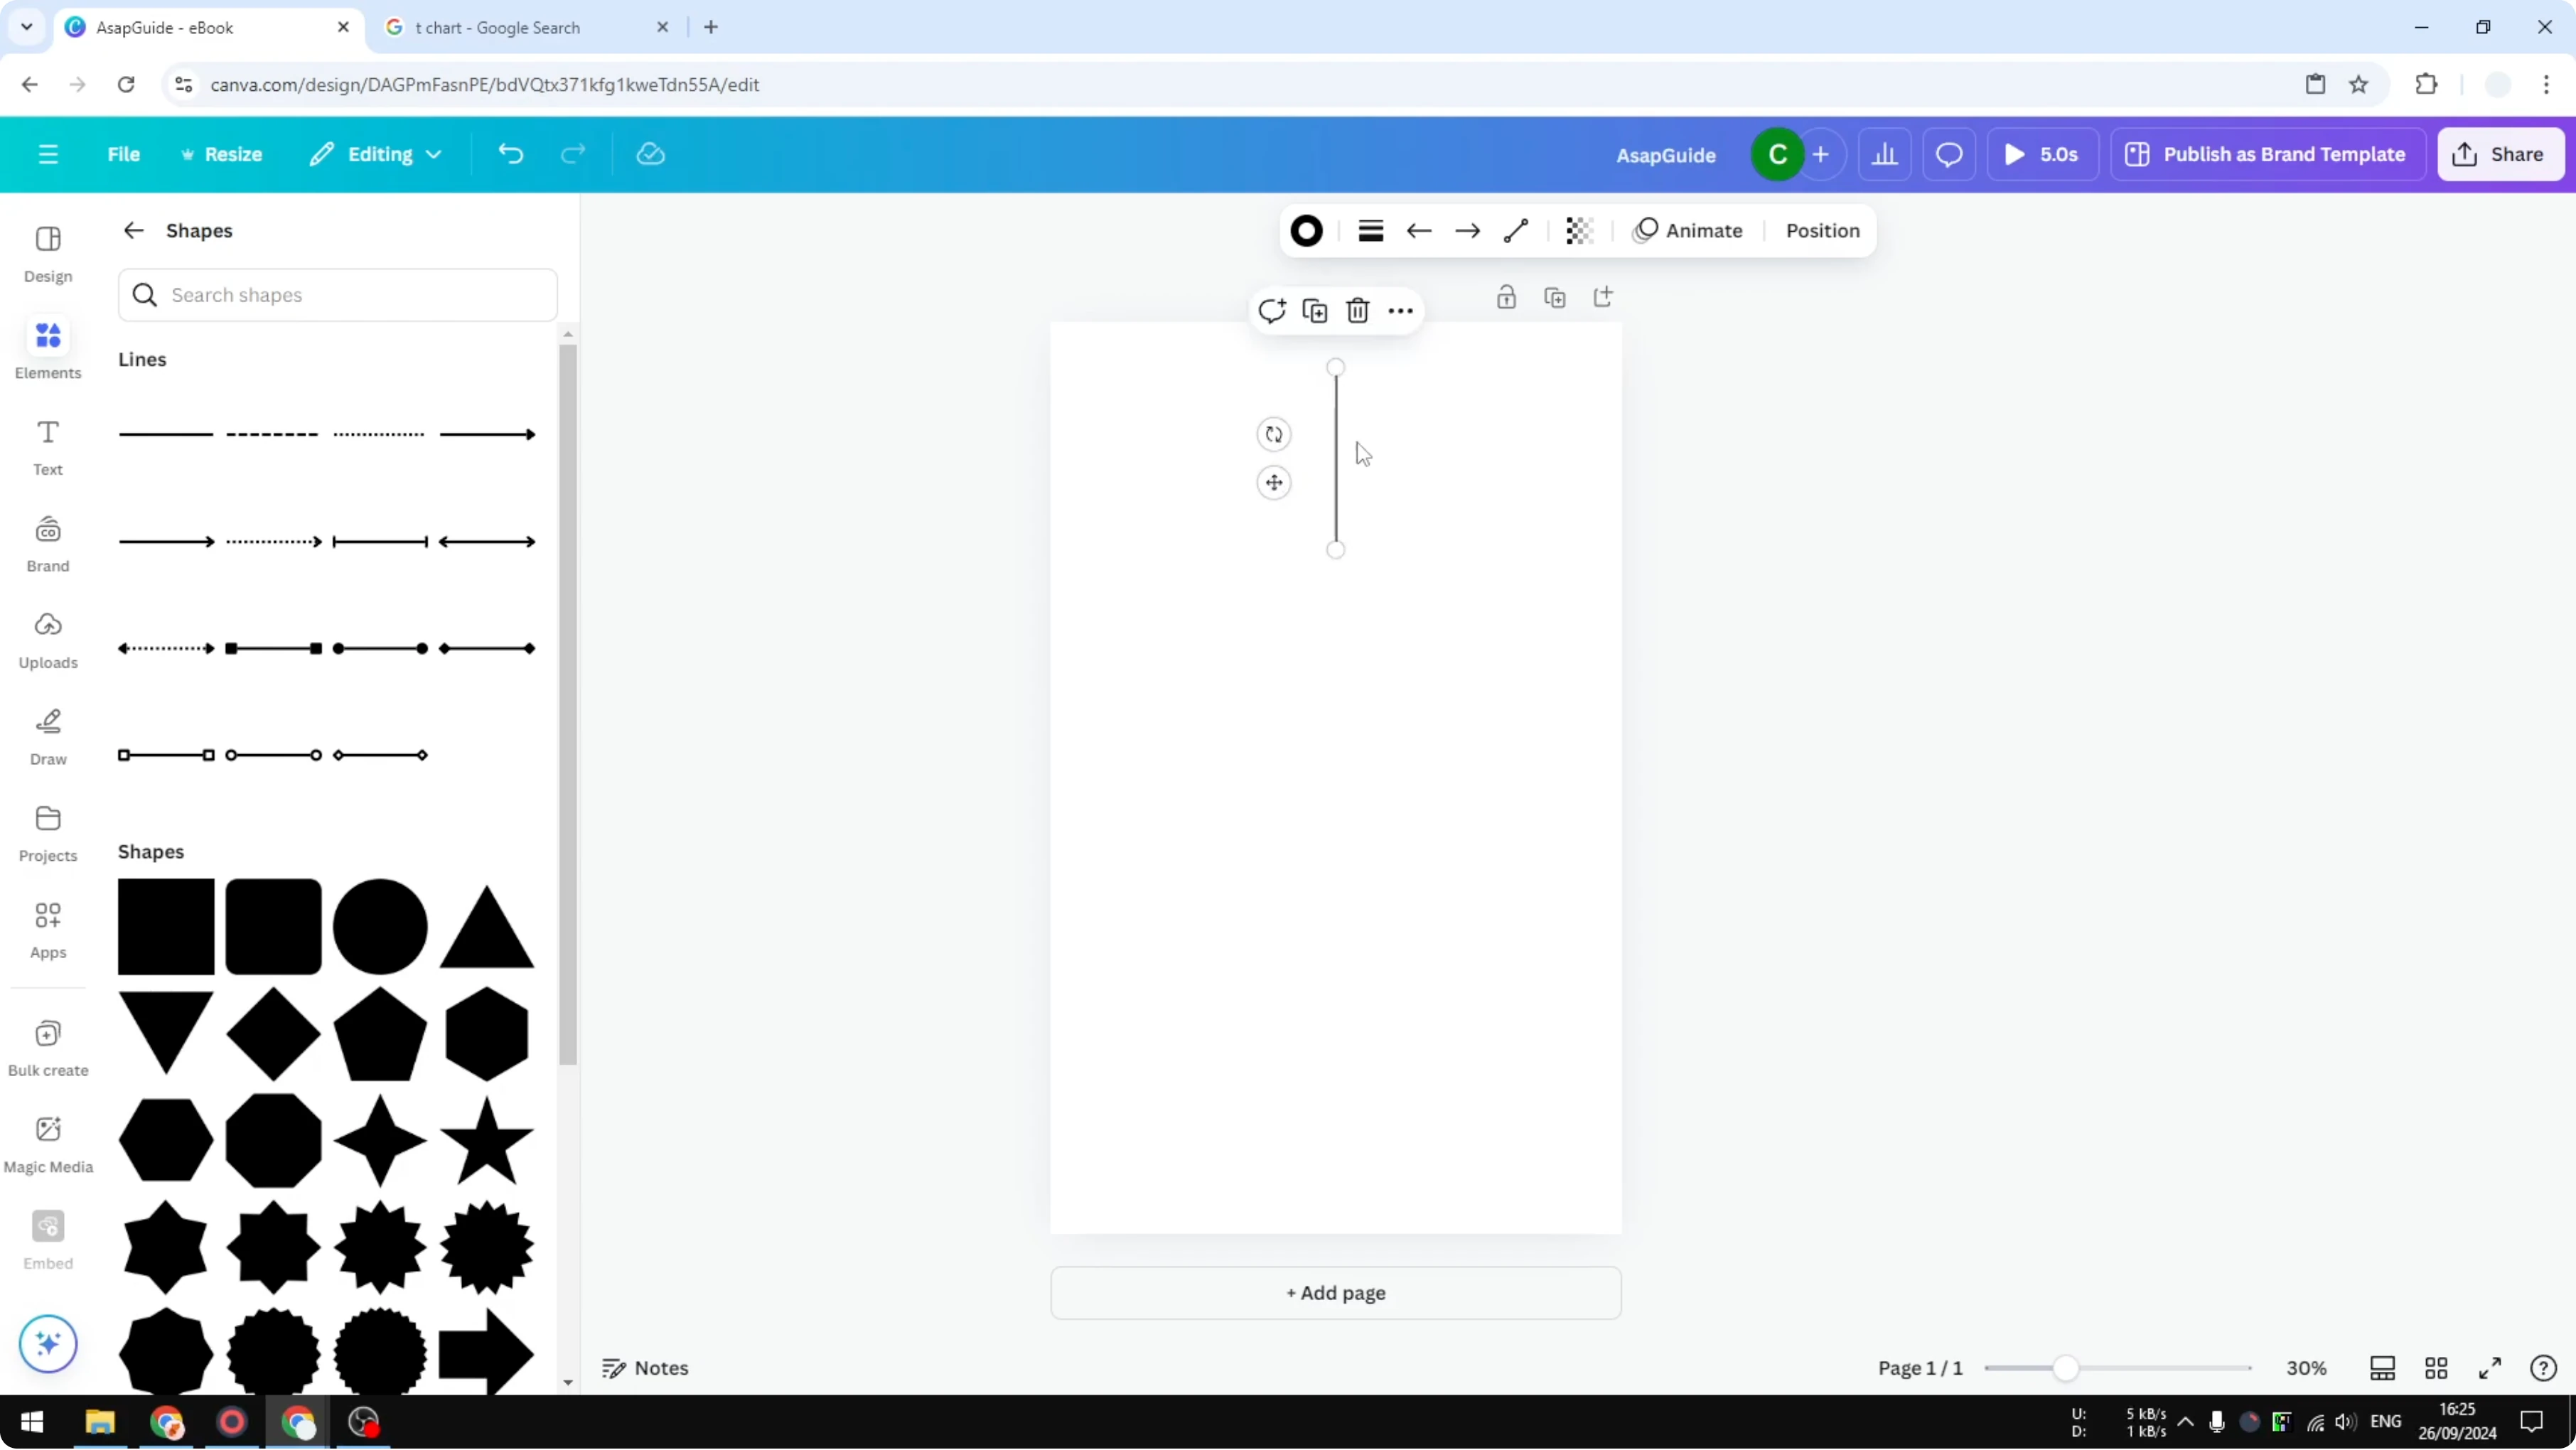
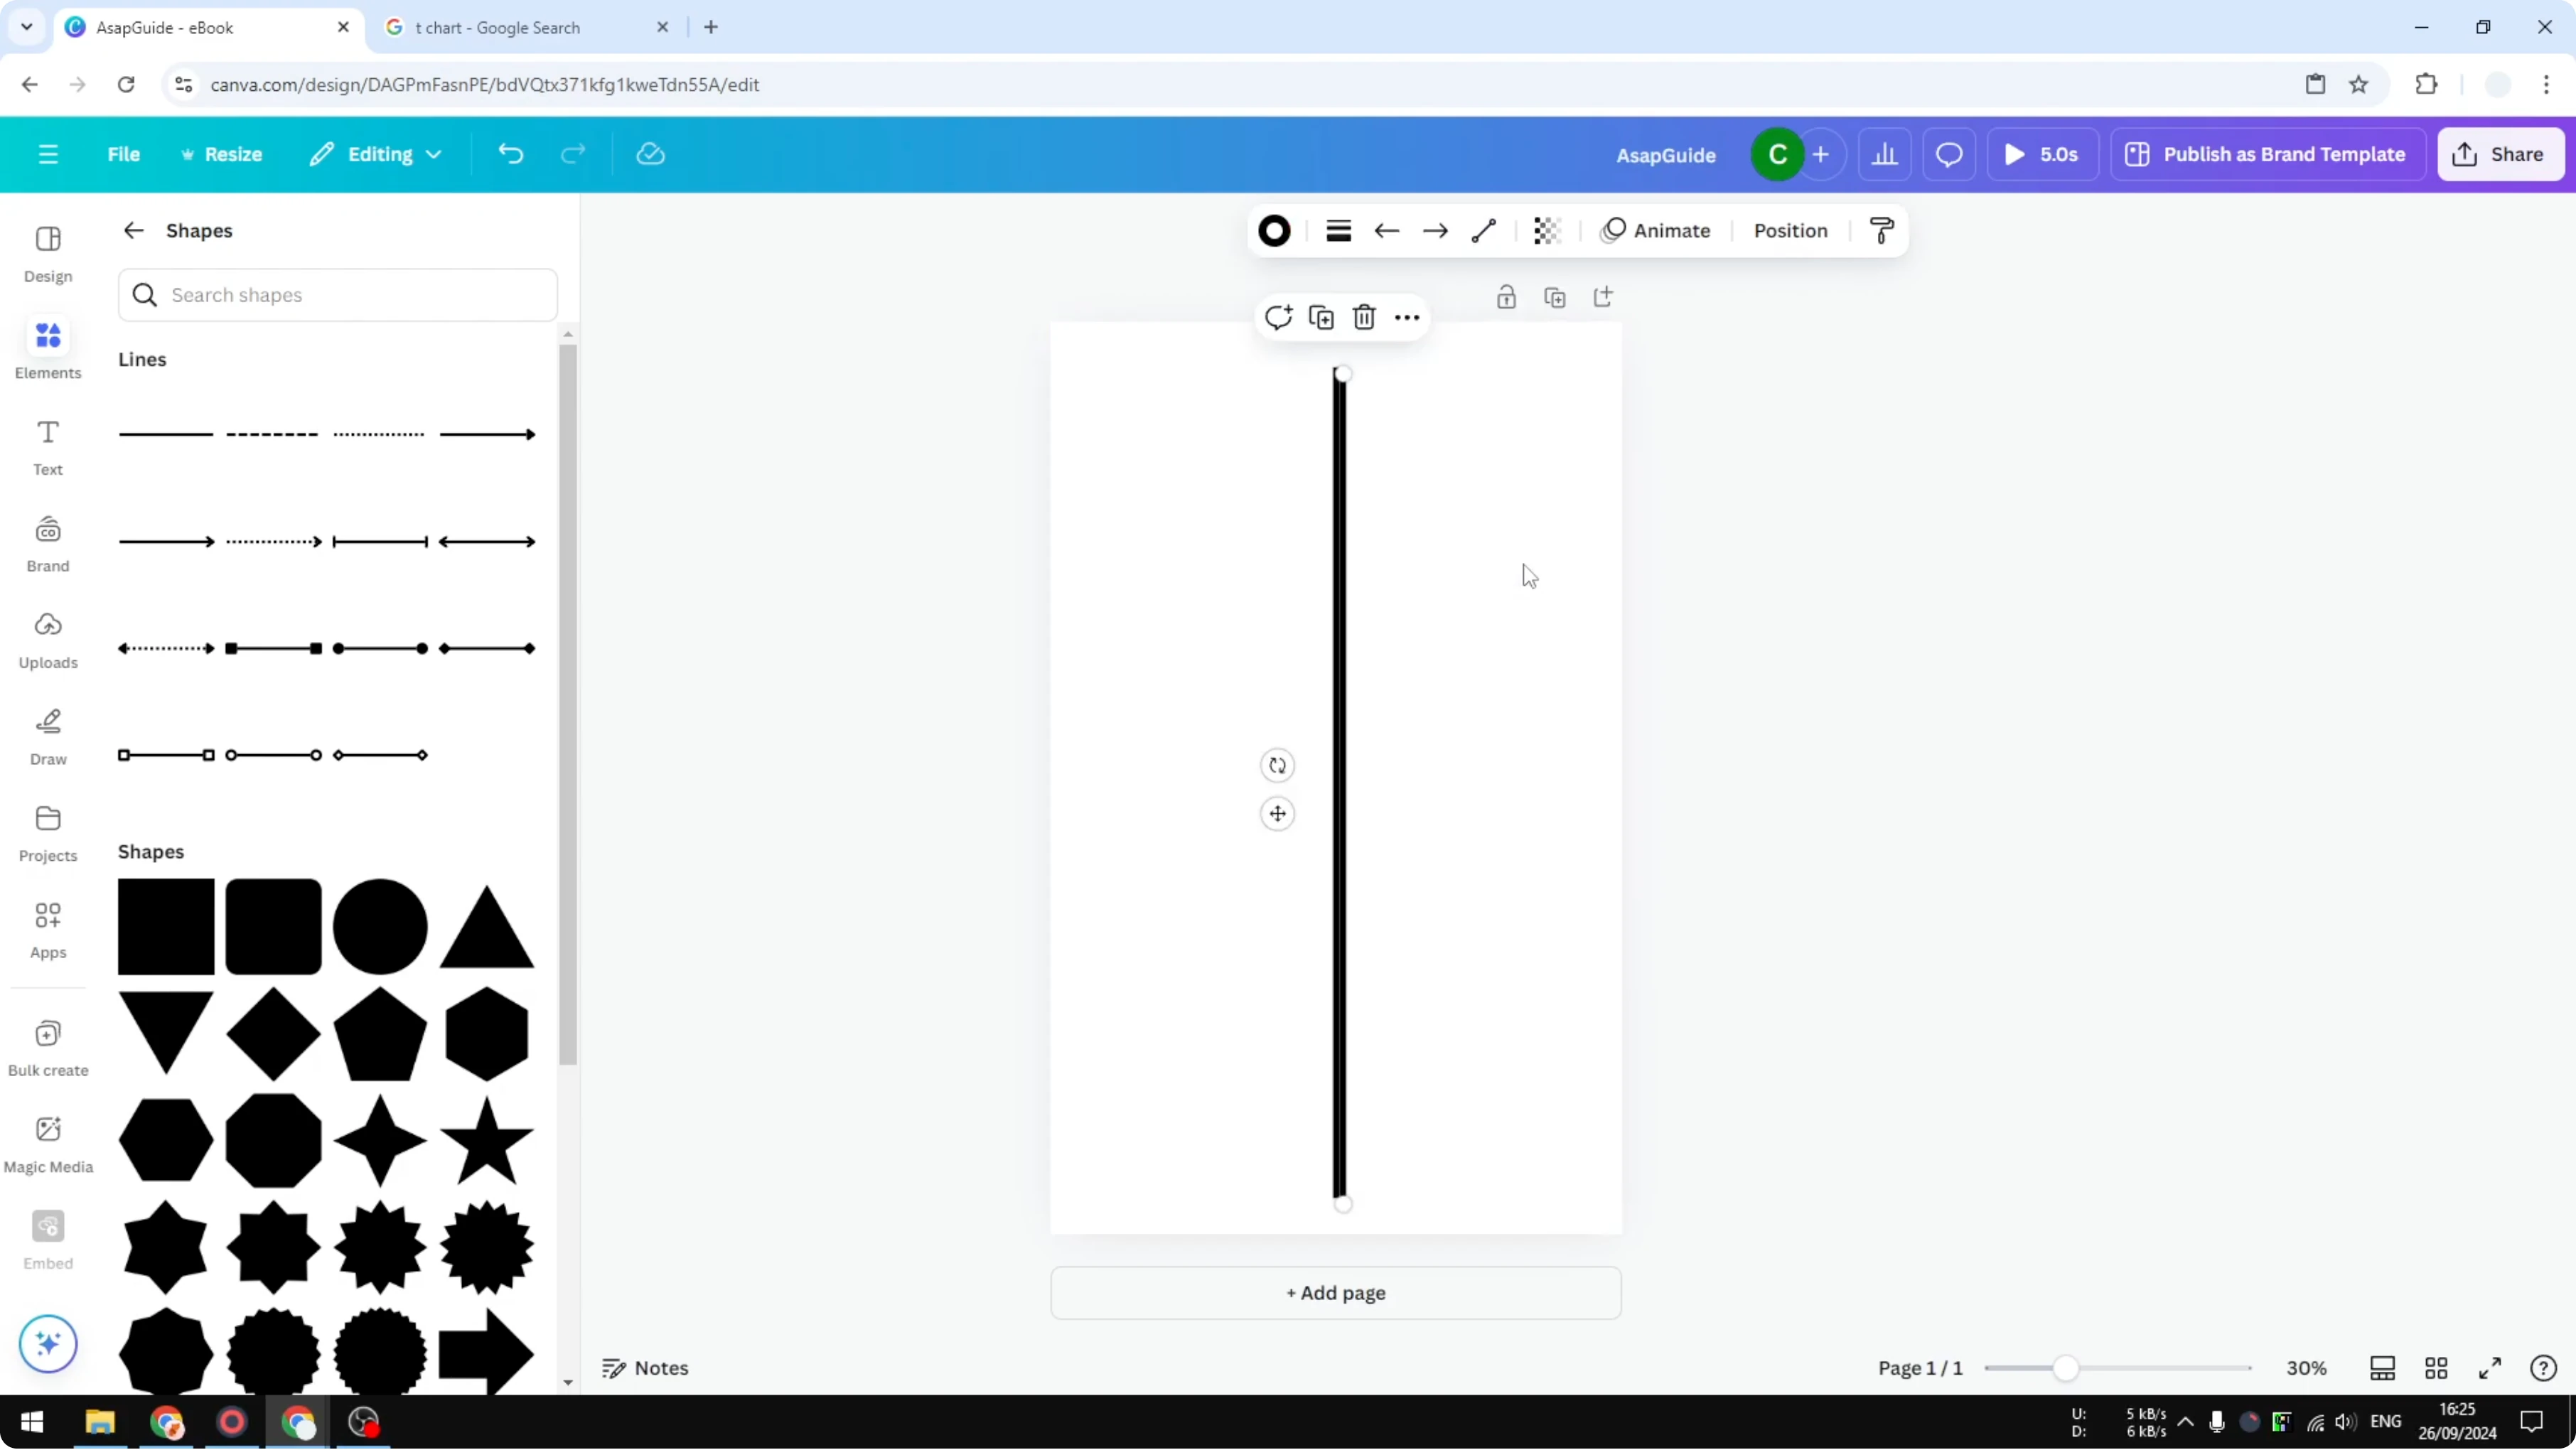
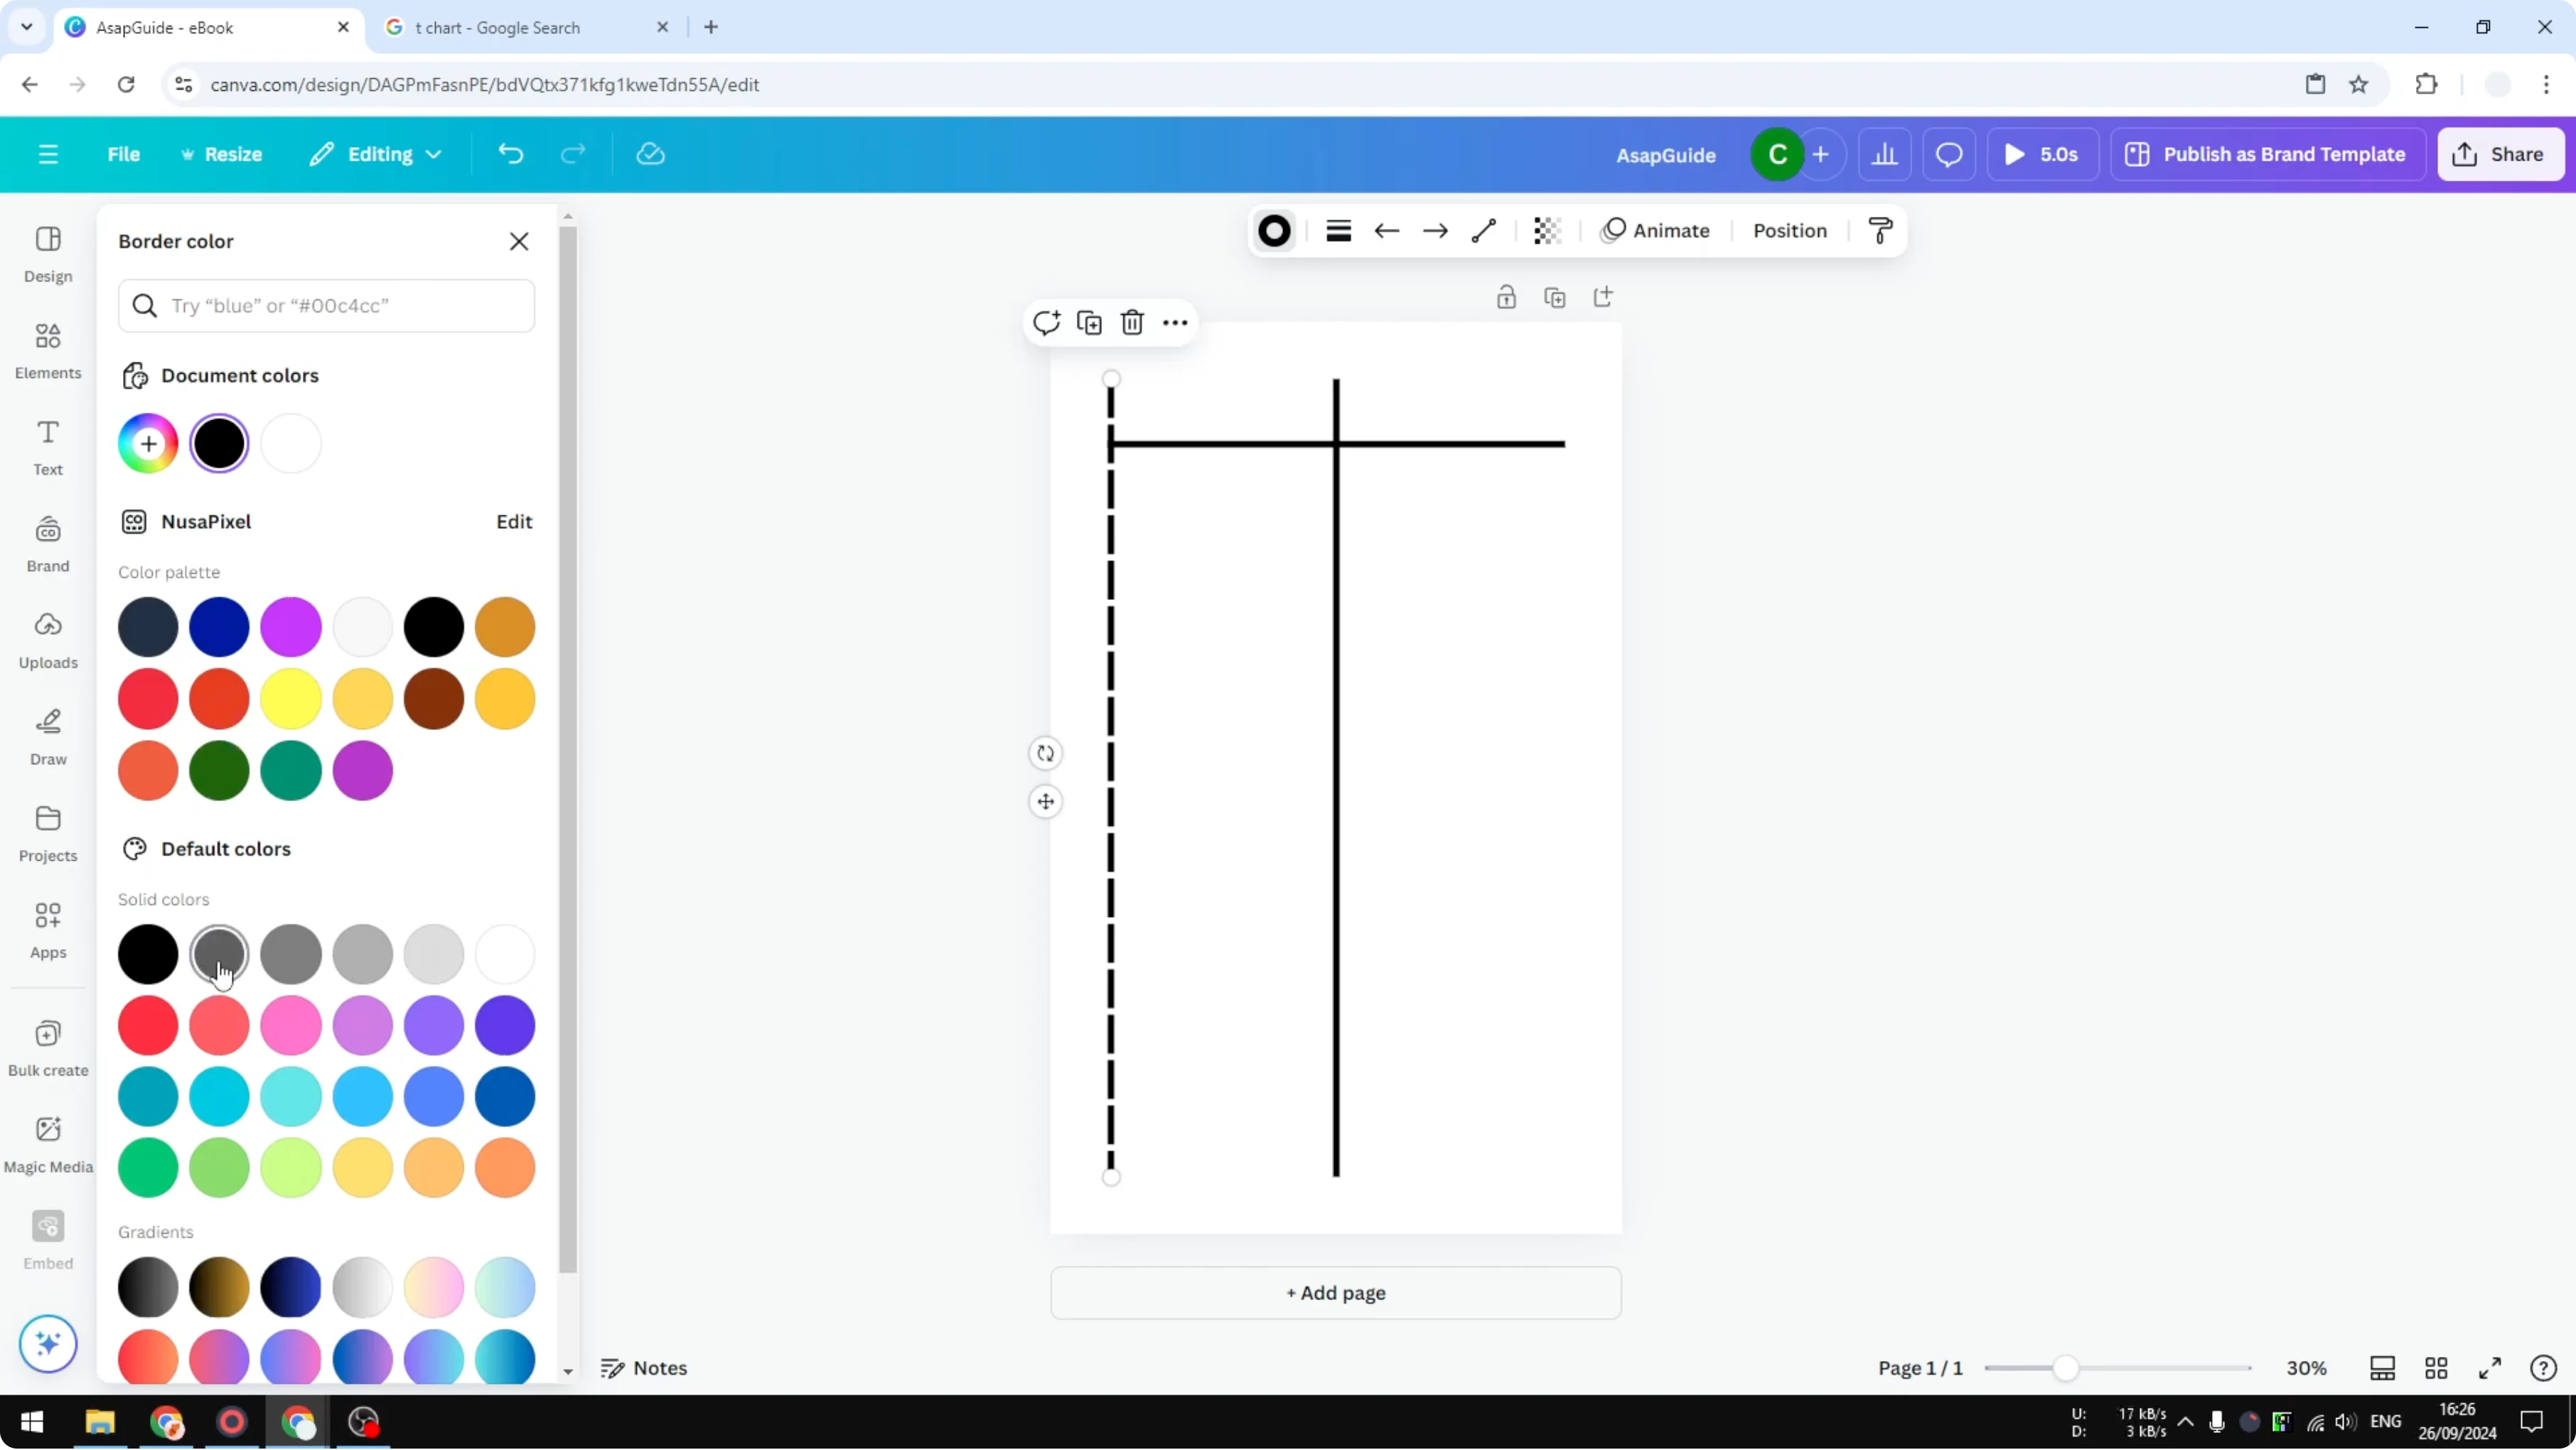
Go to Elements, open Shapes, and insert a Line. Insert the vertical line first.
Rotate it to 90 degrees, and press and hold Shift to make the angle precise. Make it bigger so the T will be clear.
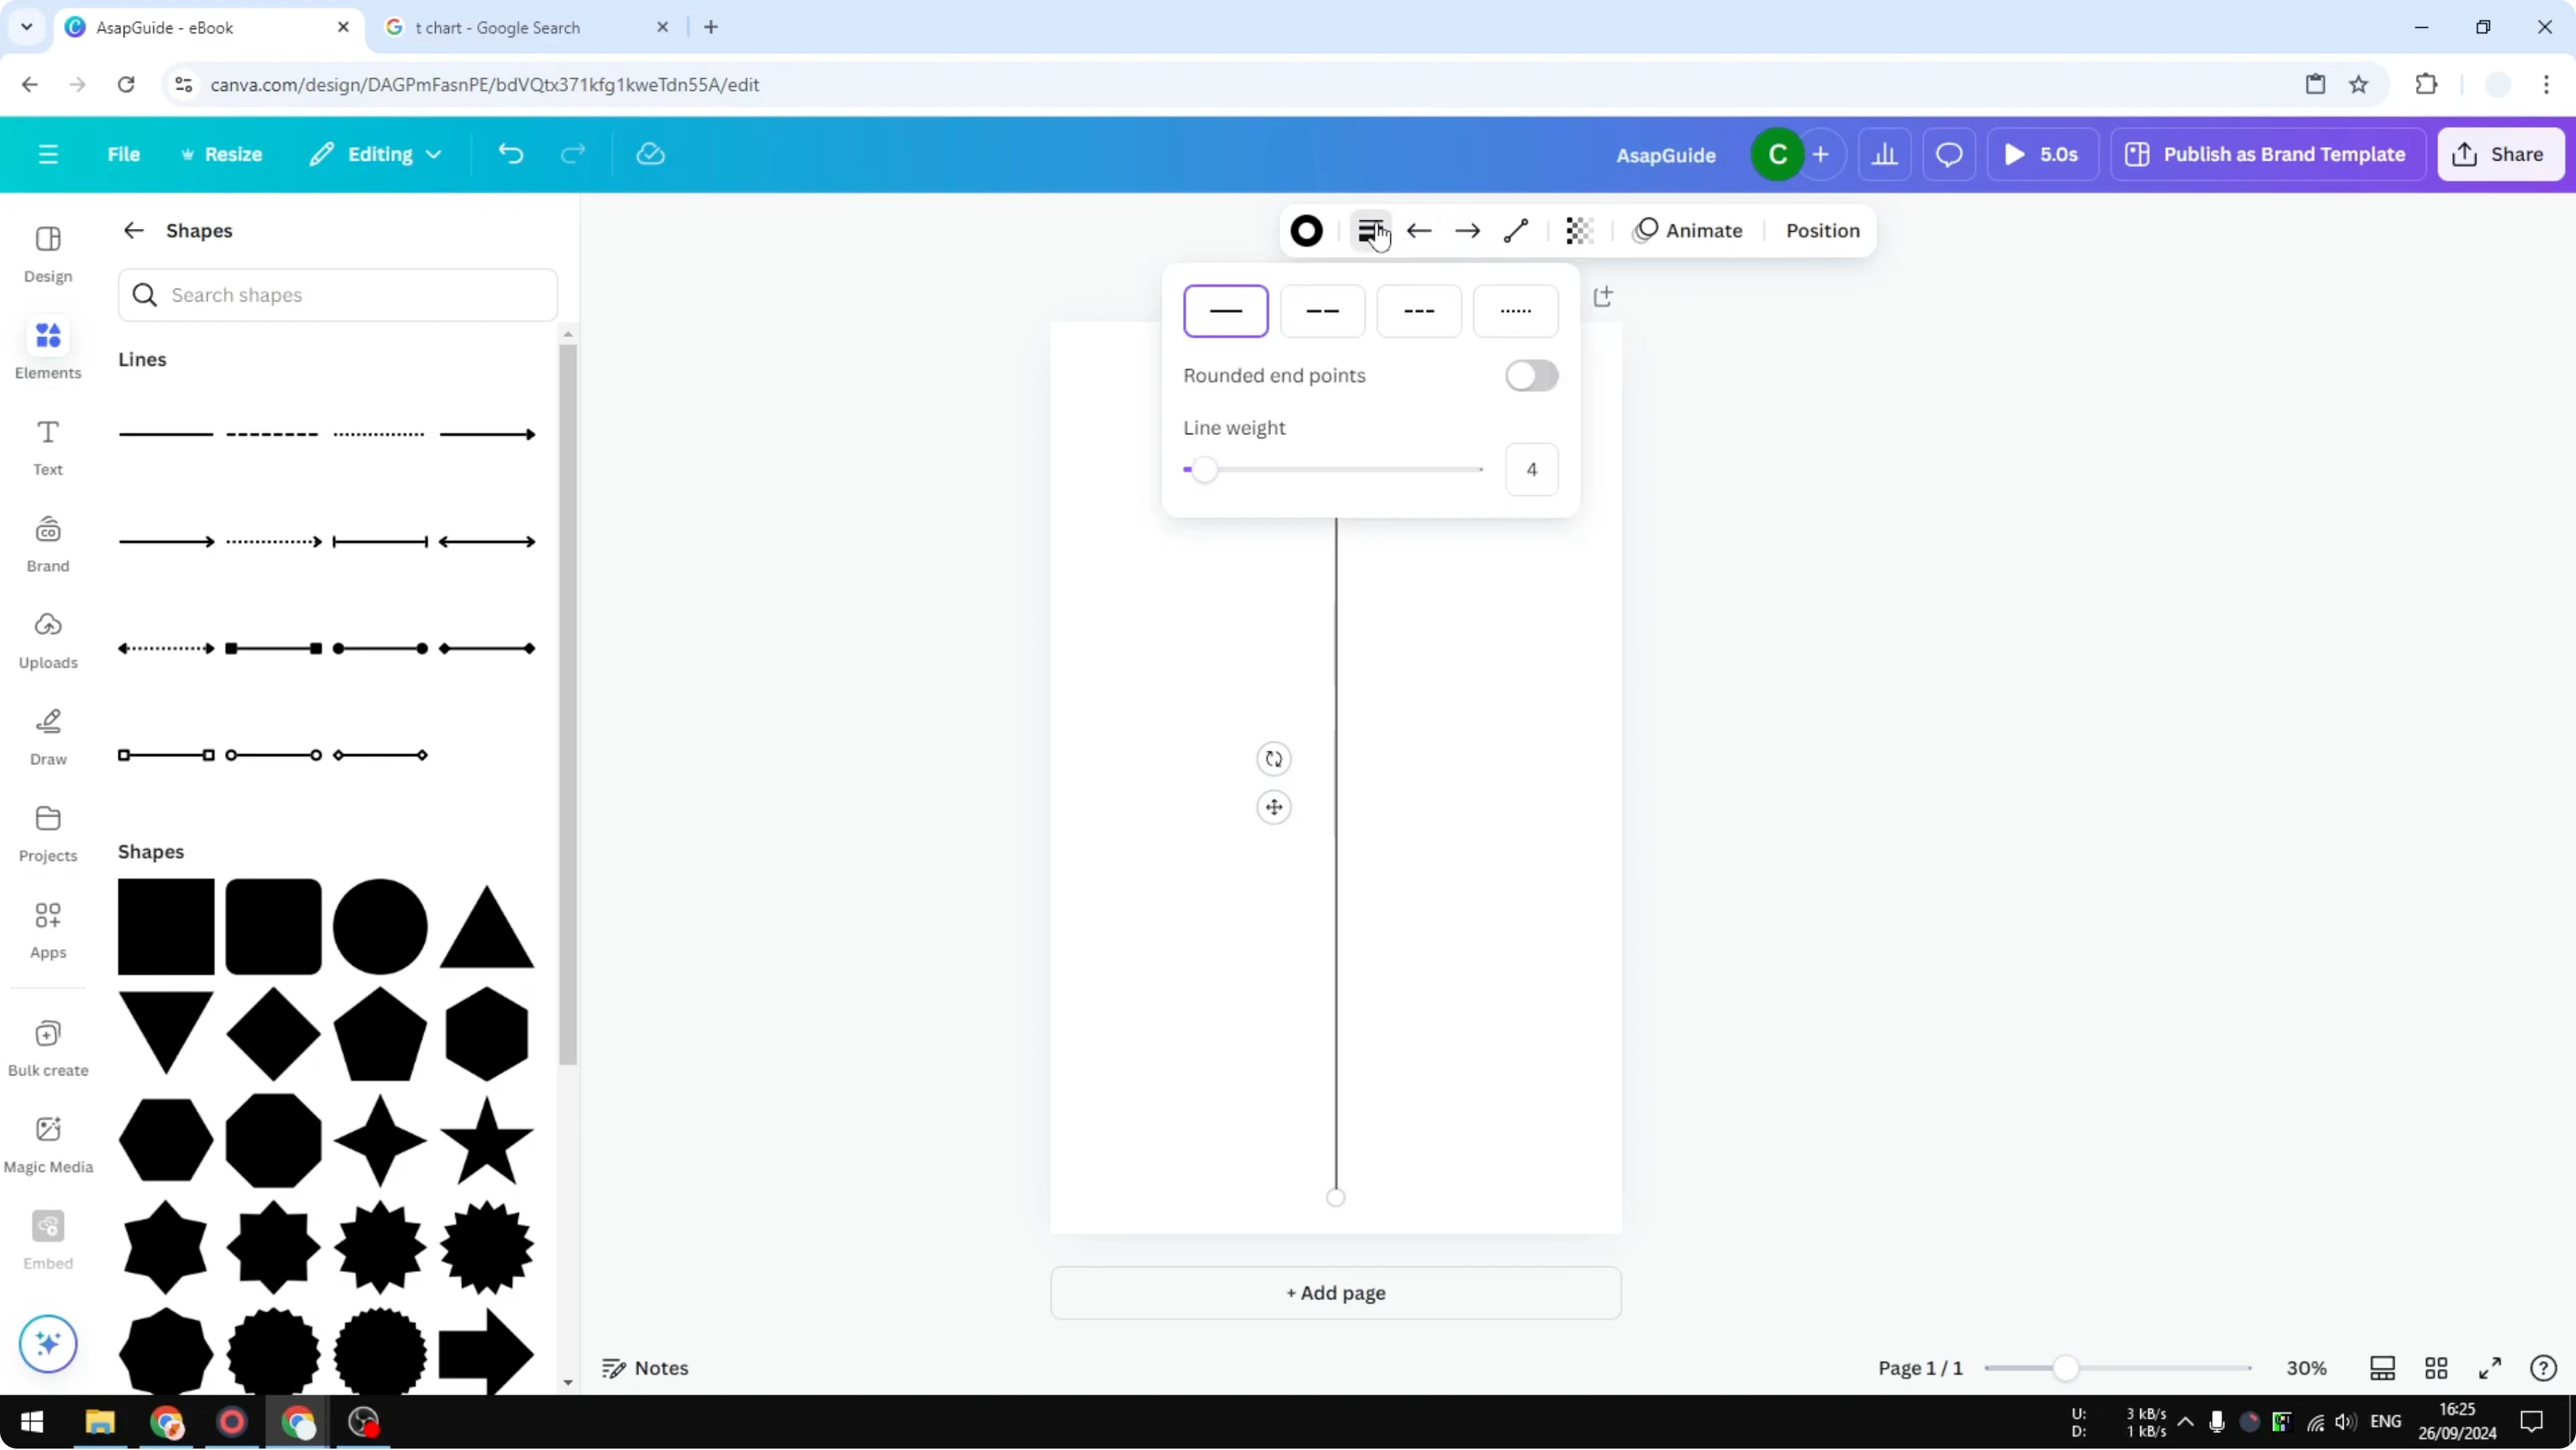
Increase the thickness to about 16 point so it is easy to see.
Horizontal line in Create T Chart in Canva
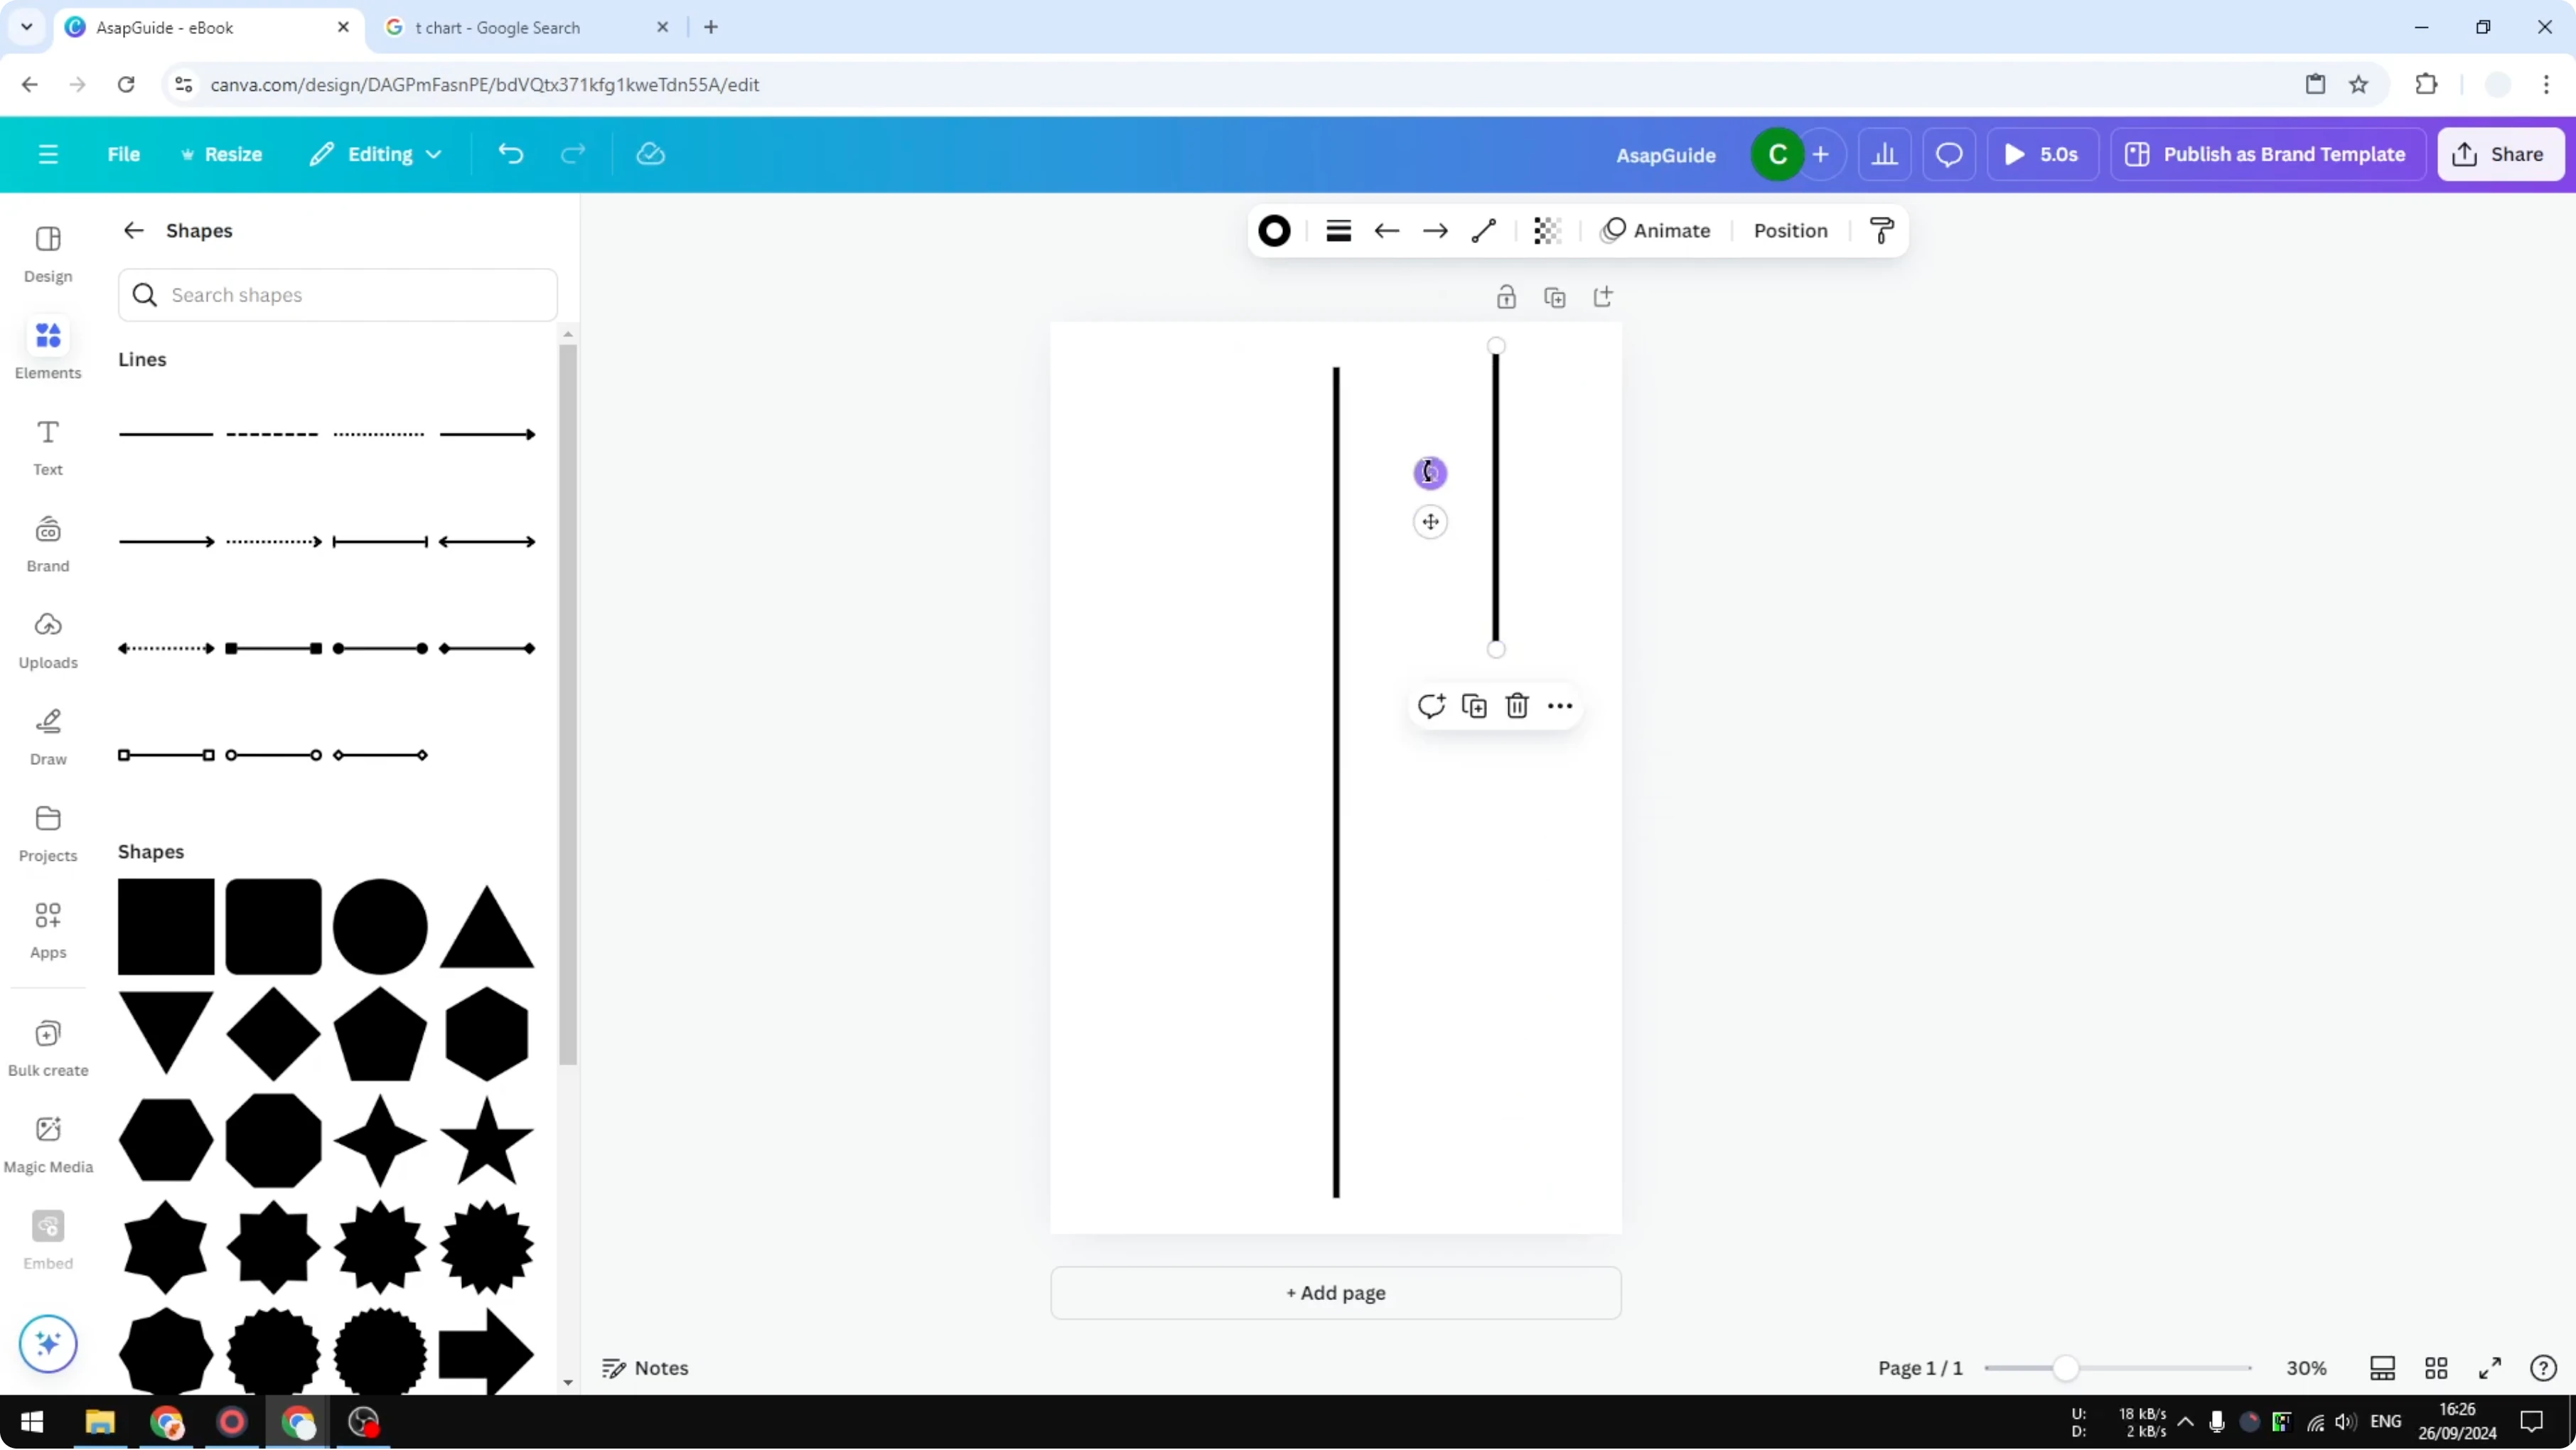
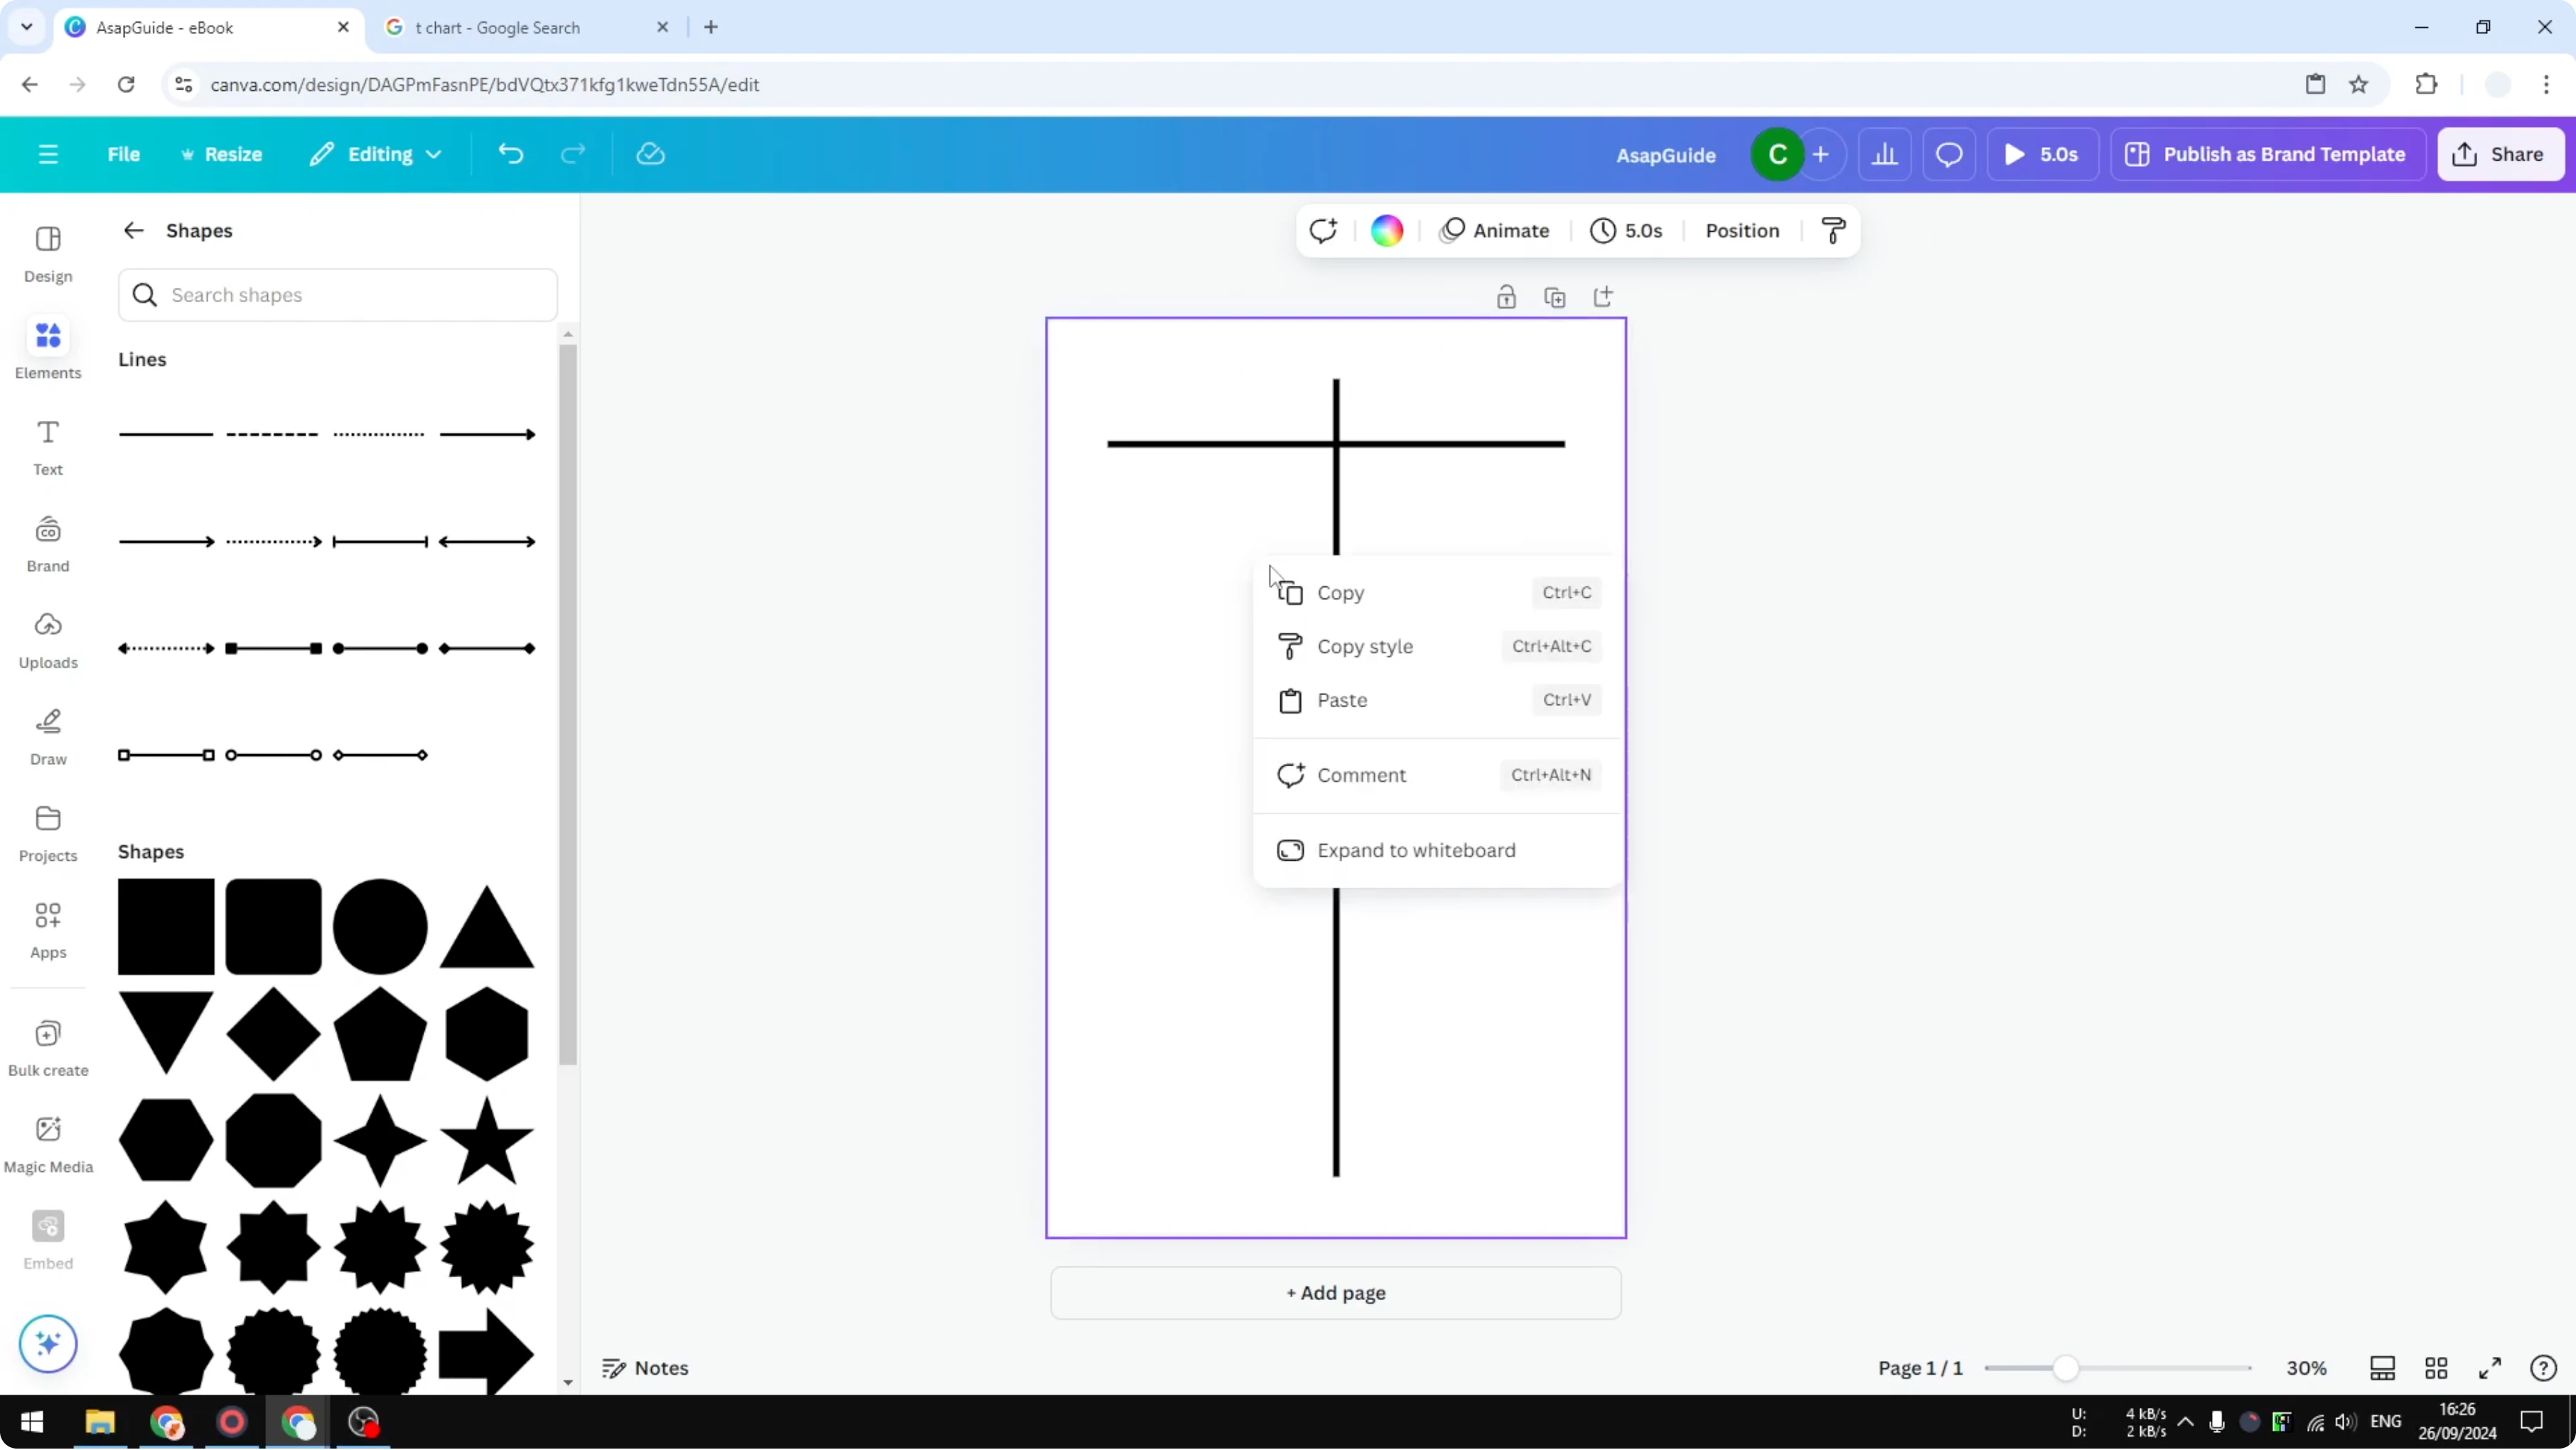
Copy the line and paste it. Make the copied line shorter.
Rotate the copied line to form the horizontal section of the T chart. Position it slightly lower so it intersects the vertical line cleanly.
For circular visuals you may also want to see donut chart in Canva.
Optional perimeter lines in Create T Chart in Canva
You can add outer lines around the chart area. These can be dashed, dots, or you can skip them entirely, based on your preference.
Add dashed perimeter
Insert another line or just copy the existing line. Change the line style to dashed.
Change the color to a more gray tone because it is not really part of the T chart. Make it thinner than the main T lines.
Place each side
Copy and paste the dashed line and place it on one side. Copy it again for the other side.

Rotate a copy to 180 degrees and place it on the top. Copy once more and place it at the bottom of the chart.

Final thoughts on Create T Chart in Canva
That is how you can create a clean T chart in Canva with just a few lines and quick formatting. You can build it fast, adjust thickness and color, and add optional perimeter lines for structure.
If you need a diagram that maps connections and relationships, see ecomap chart in Canva.
Recent Posts

How to Enhance Visuals with Realistic Fire and Smoke Effects with AI?
How to Enhance Visuals with Realistic Fire and Smoke Effects with AI?

How to Automatically Crop and Frame Your Photos Professionally with AI?
How to Automatically Crop and Frame Your Photos Professionally with AI?
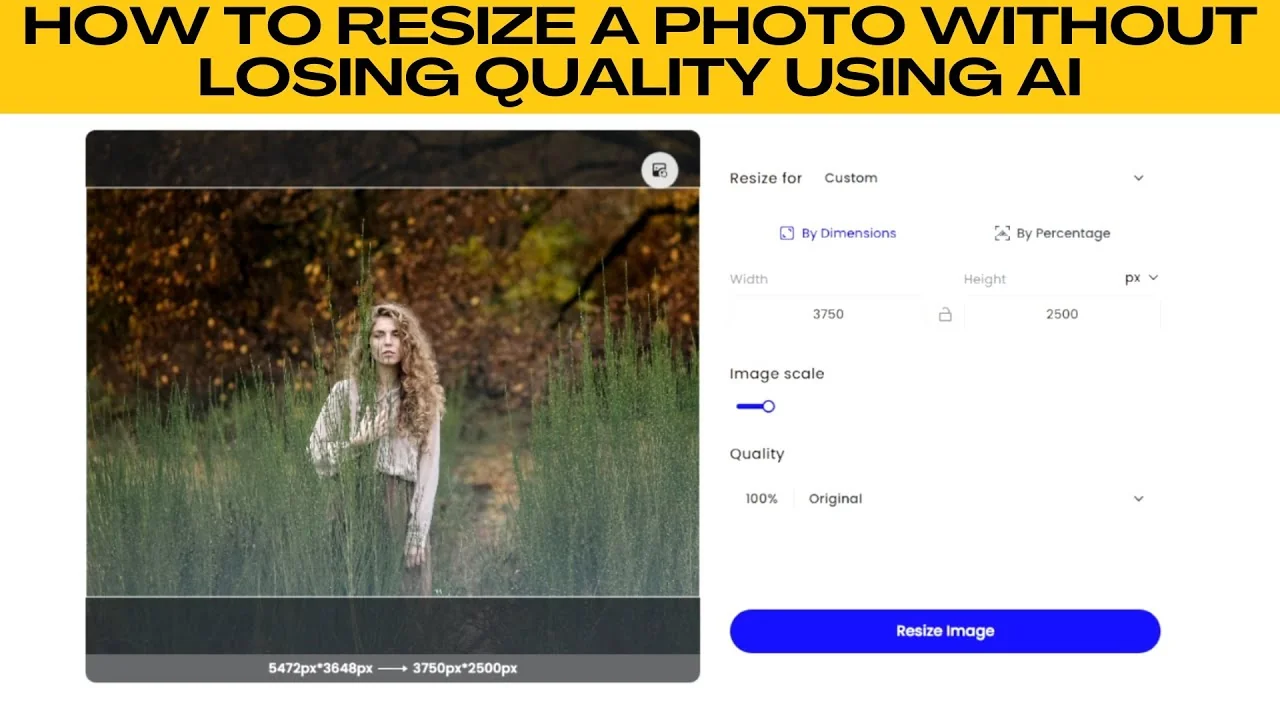
How to Increase Image Size and Resolution Without Losing Quality Using AI?
How to Increase Image Size and Resolution Without Losing Quality Using AI?